Dataset Overview
WQPredict
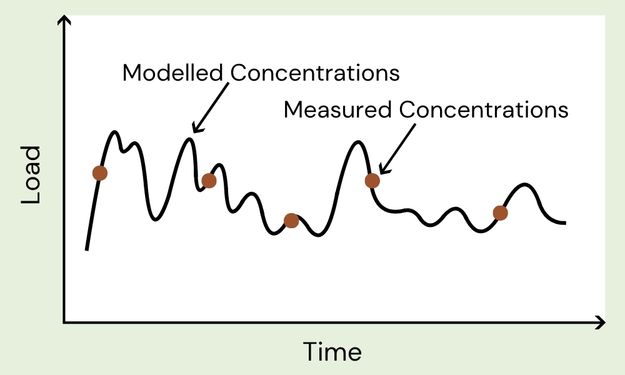
Modeled nutrient concentrations and loads for stream monitoring sites across Canada and the United States.
About this dataset
Modeled daily concentrations
Estimated nutrient loads
Fills gaps between samples
Solutes = Nitrate, total N, total P, and soluble P
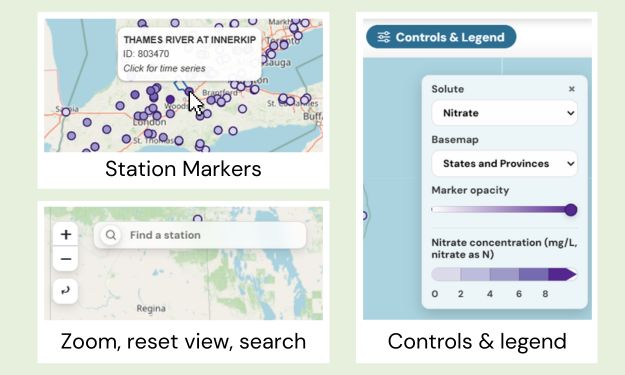
Using the map
Each point is a monitoring site
Zoom and drag over map to navigate
Use search to find a specific site
Change visible solute using dropdown
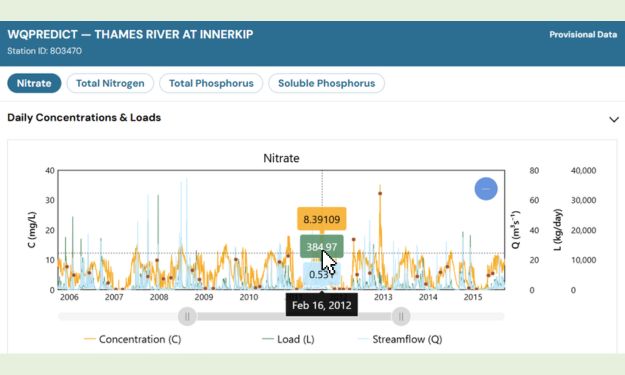
Site details & charts
Click marker to open time series window
Hover to view values
Compare loads and concentrations
Toggle solutes using top buttons