Dataset Overview
TREND
Comprehensive, spatially resolved landscape nutrient budgets over multi-decadal timeframes.
About this dataset
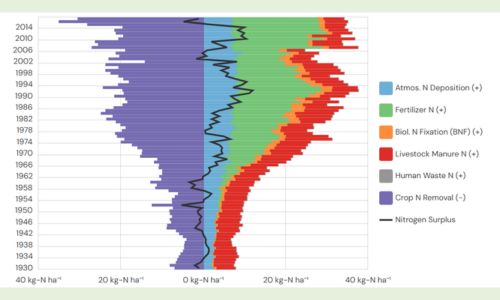
Landscape nutrient budgets across regions
Multi-decadal nitrogen & phosphorus data
Shows inputs, outputs, and nutrient surplus
Helps identify long-term nutrient legacies
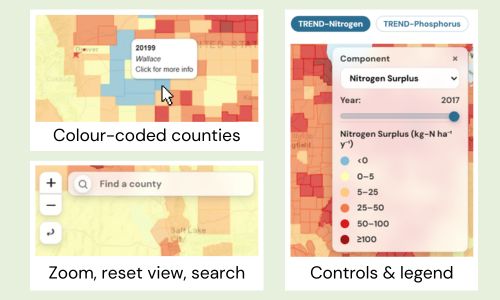
Using the map
Each region is colour-coded by component amount
Zoom and drag to explore different areas
Switch between visible component using dropdown
Use year slider to explore trends over time
Switch between nitrogen and phosphorus using top buttons
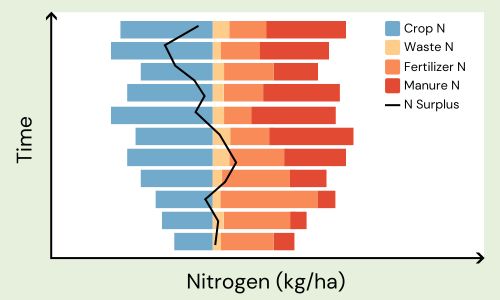
Time series
Click a county to open time-series chart
Compare inputs, removal, and surplus
Includes fertilizer, manure, fixation, and deposition